Getting a stack trace of a running PostgreSQL backend on Windows
Before you start
There are a few things you need to be aware of to get a useful stack trace:
- To get a useful stack trace, your symbol path must be configured to include the debugging symbol (.pdb) files of the programs you want to debug. See the section on the symbol path below.
- It appears that debugging a 32-bit PostgreSQL on 64-bit windows produces useless results, at least when the 64-bit debugging tools are used.
For more information, see the section on how to verify that you have a useful stack trace, below.
Methods for getting a stack trace
On Windows there are a few different methods for getting a stack trace of a backend that crashes while doing something, and a few different tools to to it with.
Methods:
- Get the process ID of a running backend, attach a debugger to it, and trigger a crash;
- Set your debugger up as the post-mortem debugger and trigger a crash; or
- Enable crash dumps, trigger a crash, and debug the resulting crash dump.
Direct attach is probably easier, but could potentially interfere with production operations. It's also not always possible, particularly when the crashes are random and hard to reproduce. You can't use a crashdump if the process is stuck (100% cpu, or just not responding and not progressing). You have to attach a debugger directly.
Setting up the post-mortem debugger can work well, but it's an intrusive system-wide change. (Use drwatson.exe to revert to the default crash handler afterwards). Not all Visual Studio editions support being used as the post-mortem debugger, and it won't work if PostgreSQL is running as a service in a separate user account.
Crash dumps (minidumps) work well for intermittent, hard to reproduce crashes. You can also use crash dumps if you need to send the debuggable crash dump to somebody else for examination. Unlike direct attach, crash dumps are supported by the free Express editions of Visual Studio. Do not just send a crash dump to someone and assume they can do something with it; you should normally extract and send a stack trace. Only send a crash dump if asked.
Tools:
- Microsoft Visual Studio Professional - supports both crash dumps and direct attach, very easy, but costs $
- Microsoft Visual Studio Express 2010 - supports both crash dumps and direct attach after enabling "Expert Settings"
- Microsoft Visual Studio Express 2012 for Windows Desktop - supports both crash dumps and direct attach, very easy
Process Explorer- only useful for getting the status of a backend without interrupting it, for tracking down apparent infinite loops etc.windbgfrom Debugging Tools for Windows - supports both crash dumps and direct attach, somewhat less than user friendly
If you have Microsoft Visual Studio, use that. It's the easiest and best option.
If you can't use Visual Studio, use Process Explorer for stack traces of running processes. For all other work, install Visual Studio. windbg is not a tool suitable for normal humans.
Installing Debugging Tools for Windows and Process Explorer
Microsoft Windows does not come with built-in debugging tools. You will need to install the Debugging Tools for Windows. These are no longer available as stand-alone packages, you must install them using the Windows SDK installer. If you like you can disable installation of everything except the debugging tools. See also here.
Once you have installed the Debugging Tools for Windows, you'll need to do a little bit of setup so you can get useful stack traces.
Note: The instructions below assume your copy of Windows is installed on c: so you may have to adjust them if this is not the case.
You will might also want Process Explorer from the Sysinternal suite. Sysinternals is useful, Process Explorer particularly so. Process Explorer can be used to get stack traces showing a snapshot of the state of a running PostgreSQL process for when you're tracking down apparently "stuck" queries.
Configuring the symbol path
First, you need to set the symbol path. First you have to figure out what it is, since it depends on the version of PostgreSQL you've installed, the language of your version of Windows, and where PostgreSQL was installed to. What you need to find is the location of the symbols folder inside the PostgreSQL install directory. If you've used the EnterpriseDB 1-click installer for PostgreSQL 9.4 and you're using an English version of Windows, it'll be:
C:\Program Files\PostgreSQL\9.4\symbols
I'll assume that's the case in the following instructions, so adjust the path shown to match your system if required.
To set the symbol path, you'll need to use the System control panel. You can get to this quickly and conveniently with all versions of Windows by holding down the Windows key and pressing the BREAK key (it's often under the Pause key). You can also find it in the Control Panel; you may need to search for "system". If you can't find it, open the Start menu and click "Run" then enter "sysdm.cpl" and press enter.
In the System control panel, click on the Advanced tab and then click "Environment Variables". An "Environment Variables" dialog will appear. In that dialog, under the label "User Variables for <username>" you'll see a list. What you need to do is click the "New" button under that list.
In the dialog that appears, enter the variable name exactly as:
_NT_SYMBOL_PATH
Note the leading underscore ("_") and the fact that the variable name is ALL UPPER CASE with UNDERSCORES_BETWEEN_WORDS.
The value is in two parts. The first part depends on where PostgreSQL is installed, as described above. The second part tells debugging tools to use a Microsoft server (the Symbol Server) to find out about parts of Windows its self.
Set the value like this, changing the path to the PostgreSQL symbols directory to match your PostgreSQL install location and version. If in doubt, look in Program Files and check. If you set it wrong there will be no error, you'll just get useless backtraces.
Example value, adjust to suit your system:
C:\Program Files\PostgreSQL\9.4\symbols;SRV*c:\localsymbols*http://msdl.microsoft.com/download/symbols;
If you don't have an active Internet connection you can download the Windows symbol package for your version of Windows and install it, but be aware that this will be a BIG download. You'll then need to adjust the symbol path shown above to point to it.
Getting the stack trace
Phew. You now have things configured and can actually start collecting information.
Important: Don't waste your time generating stack traces that're useless. Please read "How to make sure a stack trace is useful" before spending lots of time collecting information or posting to the mailing list. Your stack trace needs to contain "!SymbolicNames" as well as "+offsets" to be much use.
If you are collecting information about a postgresql backend that appears to be in an infinite loop or using too much CPU, you will need to take more than one stack trace. You should try to get quite a few over a short period of time so that developers can tell where it's spending its time. One stack trace alone doesn't really tell you a lot about what it's doing overall.
Getting the process ID of the PostgreSQL backend
Identifying the process ID of the PostgreSQL process you're interested in isn't always easy. If you have an active connection to the backend you want to look at, you can run select pg_backend_pid(); to get it's process ID. Sometimes it's obvious - it's the one using constantly high amounts of CPU as shown in Process Explorer, for example. At other times, though, you'll need to use psql or PgAdmin III to look in the pg_catalog.pg_stat_activity or pg_catalog.pg_locks tables/views to find out the process id ("pid" or "procpid") of the process you're interested in.
Debugging using Microsoft Visual Studio or VS Express
Windbg is free, quick and easy to install, supports remote debugging, and a real pain to use. You'll want something much nicer to use if you're trying to do more than just get a stack trace - and for some problems, you will indeed need more than a stack trace to know what's going wrong. If you intend to step through the execution of PostgreSQL's code and examine the value of variables, using Microsoft Visual C++ will make it a lot easier.
Microsoft Visual C++ has a much nicer debugger that I highly recommend using in favour of windbg.exe - if you have it available.
The free Visual Studio 2008 Express Edition can be used for many debugging tasks; it lacks remote debugging support and just-in-time postmortem debugging (which the full, paid edition has) but otherwise does a very good job as a user-friendly debugger.
Visual Studio Express 2010 hides, by default, key features like the ability to attach to already-running processes. Select Tools -> Settings -> Expert Settings to make that and other features visible in the usual menus. Visual Studio Express 2012 for Windows Desktop does not require such a configuration change.
Attaching
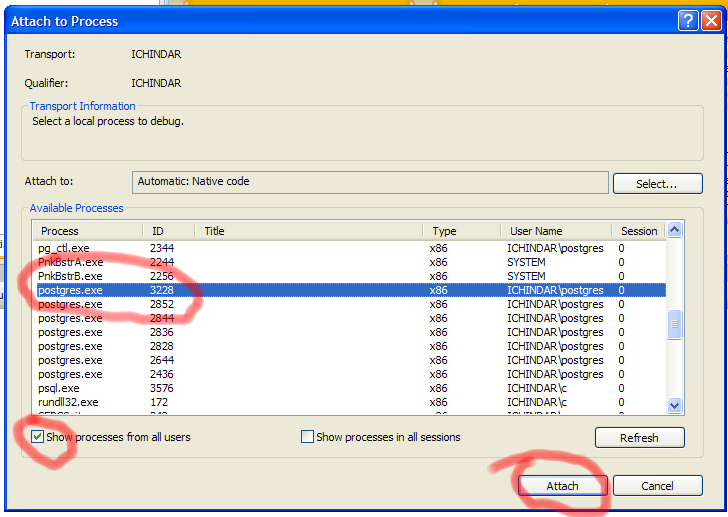
Once you've installed and configured VC++, launch it and use "Attach to Process" in the Tools menu to connect to the PostgreSQL backend you want. Make sure "show processes from all users" is checked, select the postgres.exe process you want to debug, and click "Attach". You'll get a security warning, which you should read and understand before accepting.
VC++ will load symbols for PostgreSQL, which may take a few minutes if you haven't used VC++ to debug PostgreSQL before (it'll have to fetch them from the symbol server). Once VC++ finishes loading symbols, execution of the Pg backend will resume and your database system will be working normally.
Breaking into execution
You can now break into the execution of the postgres.exe backend with the break button on the toolbar. It looks like a pause button. If you're debugging a runaway backend, you'll want to break into its execution now. Alternately, if you're debugging a crash, you should trigger the crash now.
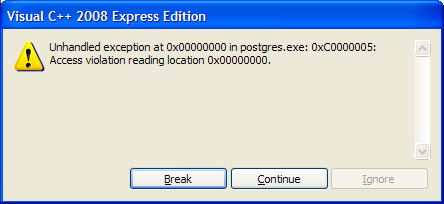
If VC++ detects a crash it'll display a dialog like this to give you the chance to break into the process's execution:
If you break into a process's execution while it's running in the kernel you'll see a dialog like this:
... which is common for PostgreSQL since it'll often be waiting for network or disk activity. You can generally ignore it.
Starting debugging
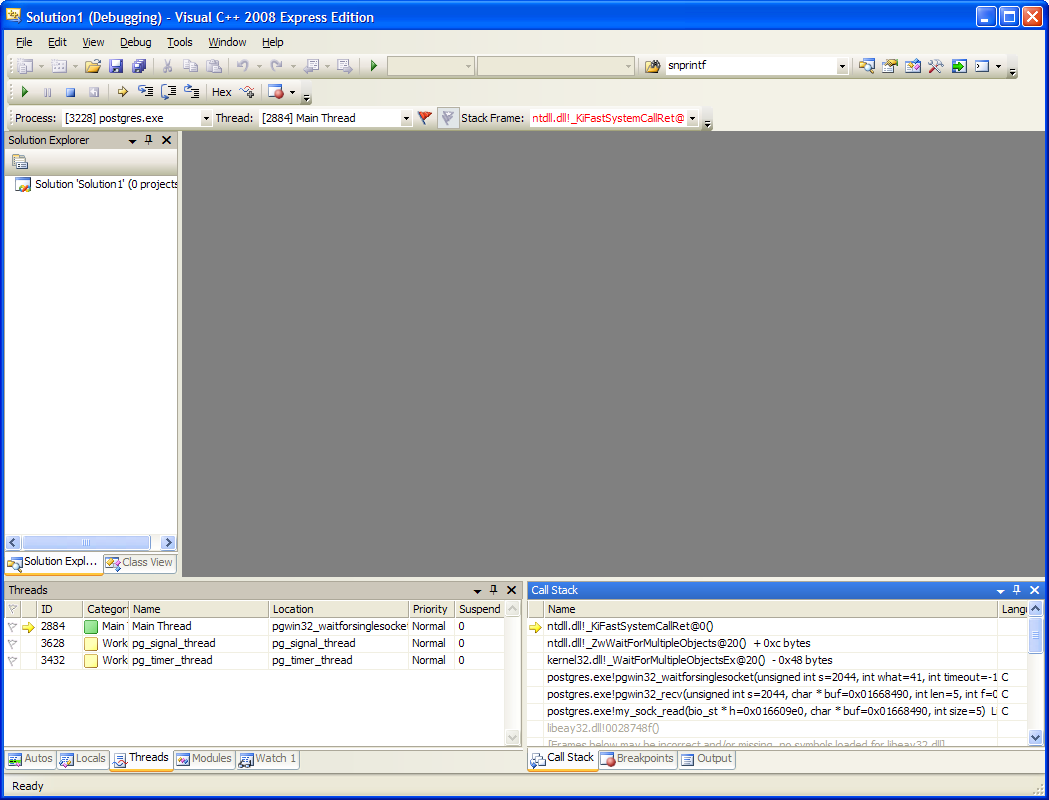
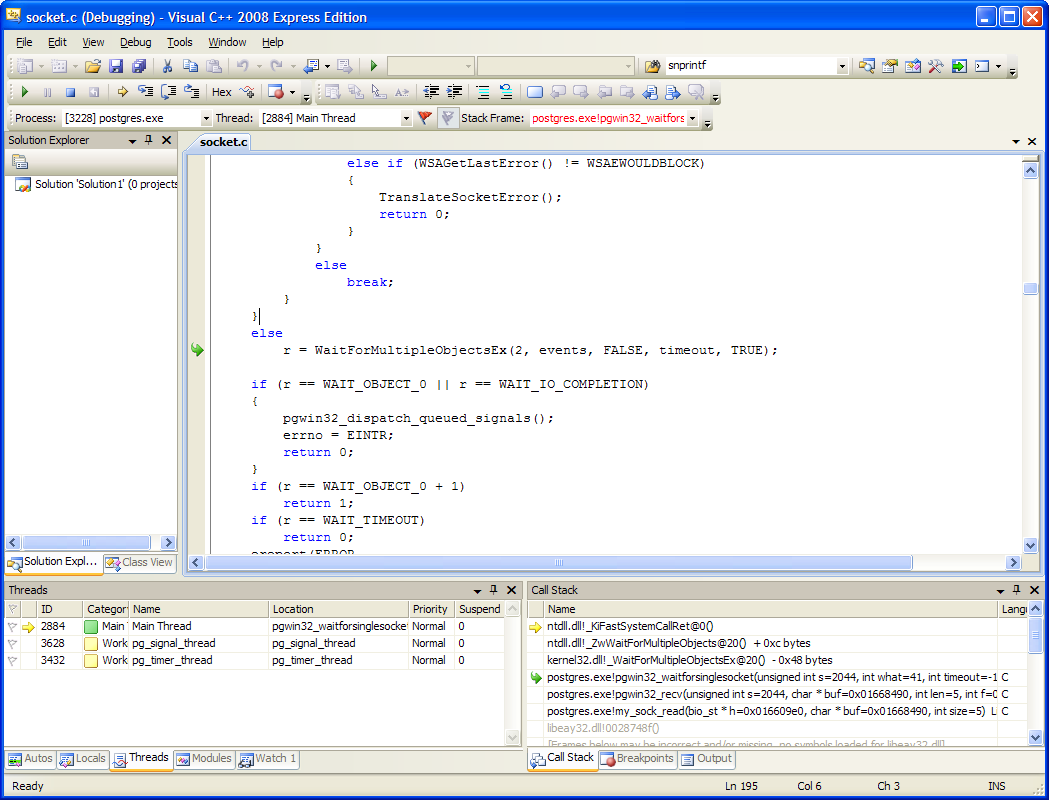
You'll get a dialog telling you that "there is no source code available for your current location". Click OK. Now, on the bottom right (by default) you'll see a set of tabs named "call stack", "breakpoints", and "output". Click on "call stack".
You can see the stack of function calls that were in progress in Pg's main thread at the time you interrupted postgresql. (If you want or need to change threads, use the "threads" tab on the bottom left - double click on the thread of interest to debug it - though you usually want the main thread which is active by default).
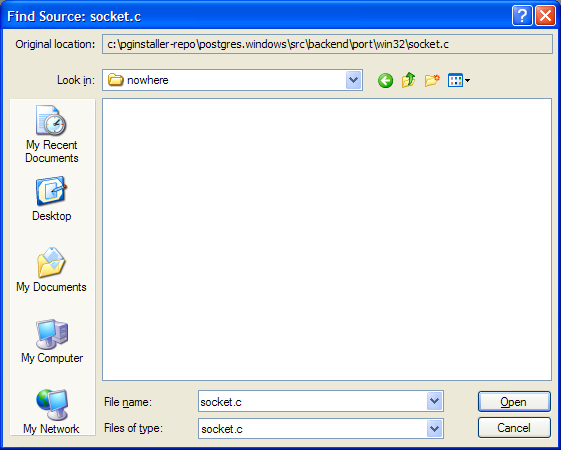
In the call stack you can double-click on an entry to see where in the executable the function call arose. If you don't have source code, it'll offer to show you a disassembly, but you have source code for PostgreSQL so you can do better than that. (If you don't have source code for Pg, download and extract the sources for your version now. If you can't open the .tar.gz file, install [www.7-zip.org/|7-zip]). Double-click on the topmost line in the stack trace that starts with "postgres.exe" and a dialog will appear asking for a .c file:
It'll note the original location of the file at the top of the dialog. In my case, it wants socket.c from src\backend\port\win32\socket.c, so I find the postgresql sources (on my machine: c:\developer\postgresql-8.4.0) and from there open src, then backend, then port then win32. Visual studio notices "win32.c" within the directory and opens it automatically. From now on, during this debugging session VS should find all other postgresql source files too.
Debugging tips
The Visual Studio debugger is far too capable to fully describe here. I'll just give a few hints - and suggest that you use the documentation.
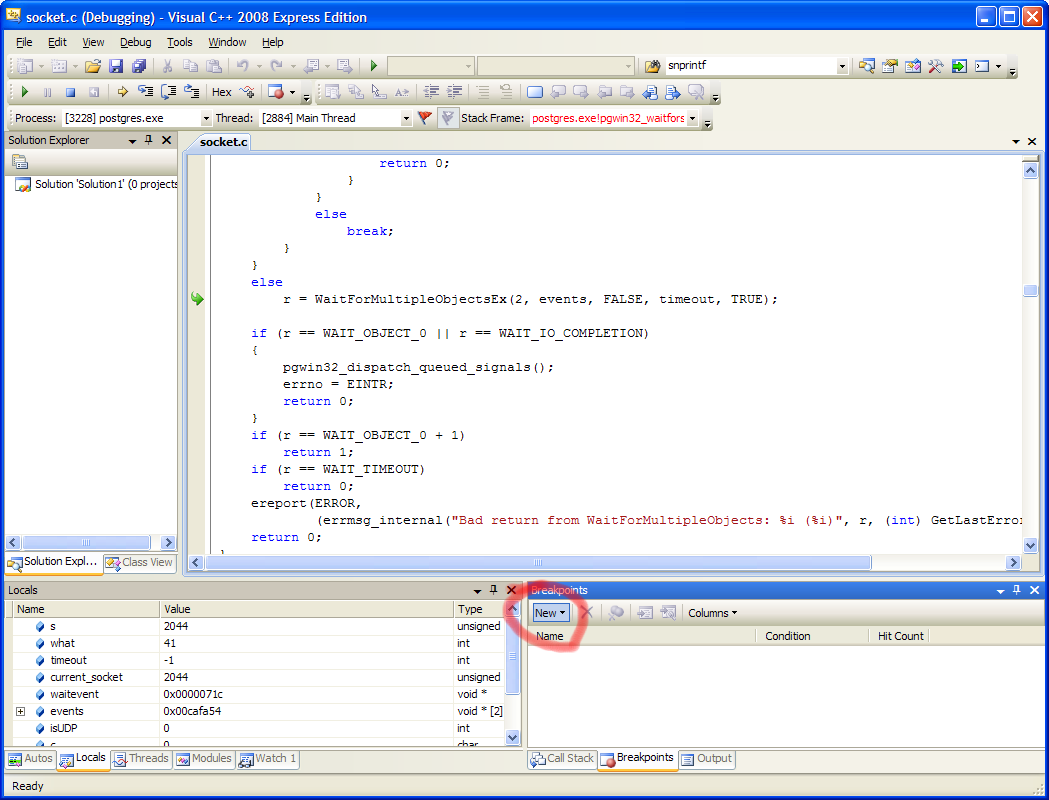
Now that you have sources displayed, you can step through the code line-by-line, run until the end of functions, step into functions, and otherwise control the execution of the PostgreSQL process in detail using the buttons on the toolbar. You can also examine local variables at the stack frame you're on using the "locals" tab on the left, set breakpoints in functions using the "breakpoints" tab on the right, etc.
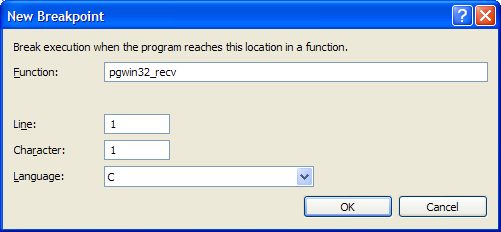
For example, if I wanted to pause execution the next time PostgreSQL tried to receive data from the network I might set a breakpoint on the pgwin32_recv function and resume execution:
If I then issue a query on the backend I'm debugging, Visual Studio will shortly break back into the debugger at the start of the pgwin32_recv function. I can now step through the function's execution to see what functions are called, what values variables take, etc. I can add and remove breakpoints by clicking in the margin on the left of the source file display.
Note that you must be careful not to change the values of any variables or cause execution to skip lines using the "set next statement" option. If you're not careful you could crash the server or possibly severely corrupt your database.
Using windbg
Using windbg.exe to debug PostgreSQL
Using crash dumps to debug random and unpredictable backend crashes
If the crashes appear to be random and you don't know how to trigger them, it's hard to connect a debugger to the problem postgres.exe before it crashes.
Setting your debugger as the JIT (just-in-time) or post-mortem debugger won't help you, because PostgreSQL generally runs as a service under a different user account that cannot interact with the desktop. You could always initdb a new cluster under your normal user account and use pg_ctl to start the postmaster with that cluster manually, so you can JIT debug under your own user account where Pg can interact with the desktop. This isn't suitable for production use, though, and you might not be able to reproduce the problem that way.
In PostgreSQL 9.0 and above there is a crash dump hander included in PostgreSQL. To use it:
- Create a directory named
crashdumps(all lower case) in the PostgreSQL data directory (as shown bySHOW data_directory;inpsql) - Give the PostgreSQL user (
postgresby default) "full control" of it in the security tab of the folder properties - Run the problem code. You don't need to restart Pg or change any settings.
- When a backend crashes, a Windows minidump should be created in the
crashdumpsdirectory.
You can debug this file with Microsoft Visual Studio or with windbg, using much the same procedures you use when attaching to a process ID as explained above. Unfortunately the more recent Express editions of Visual Studio do not have the ability to debug minidumps.
Minidumps can also be sent to somebody else to debug. For this to work you must tell the other person the *exact* PostgreSQL version you are using, because the debug symbols vary from minor release to minor release. You can't debug a 9.1.0 minidump with debug symbols taken from a 9.1.1 install. It's often easiest to just send them the .pdb files from your install alongside the minidump.
Debugging crashes during postmaster start
This article discusses debugging of crashes during service startup.
Using Process Explorer to see what running backends are doing
Process Explorer is only useful for getting stack traces from running backends. It is not useful for debugging crashes.
If you intend to use Process Explorer to get a basic stack trace of a running (non-crashed) backend, you need to apply some settings first. You can skip this section if you're going to use Visual Studio (recommended if you have it) or windbg from Debugging Tools for Windows.
Initial Process Explorer configuration
Open Process Exploer from the start menu, use "procexp.exe" in the Start->Run dialog. Read and accept the license agreement if prompted.
Now, in the "options" menu choose "configure symbols". First, note the "symbols path" entry, which should be the same as the value you entered for _NT_SYMBOL_PATH in the System control panel. If it isn't, you've made a mistake setting up the environment variable for the symbol path in the System control panel.
There is another entry in the "configure symbols" dialog labelled "dbghelp.dll path". If this begins with "c:\windows" you'll need to change it to the alternative provided by the Debugging Tools for Windows. The exact location varies depending on your debugging tools version. Use the "..." button, type %ProgramFiles% into the "file name" field and press enter. Now find the debugging tools for windows folder, open it, and find dbghelp.dll. Double click on it. The dbghelp.dll path should've changed to something like:
C:\Program Files\Debugging Tools for Windows (x86)\dbghelp.dll
You can now click "OK".
Checking your Process Explorer setup
You should now be able to look at the stack trace of a commonplace process that's pre-installed on Windows systems. I suggest starting Notepad (start->run->notepad.exe), then launching Process Explorer, double-clicking on "notepad.exe" in the process list, switching to the "threads" tab, and double-clicking on the only entry in the list shown there. The displayed stack trace should look like this (on Windows XP SP3 at least):
ntkrnlpa.exe!KiSwapThread+0x46
ntkrnlpa.exe!KeWaitForSingleObject+0x1c2
win32k.sys!xxxSleepThread+0x192
win32k.sys!xxxRealInternalGetMessage+0x418
win32k.sys!NtUserGetMessage+0x27
ntkrnlpa.exe!KiFastCallEntry+0xf8
ntdll.dll!KiFastSystemCallRet
USER32.dll!NtUserGetMessage+0xc
notepad.exe!WinMain+0xe5
notepad.exe!WinMainCRTStartup+0x174
kernel32.dll!BaseProcessStart+0x23
If it looks like this instead (lots of lines with just "modulename+offset" not "modulename!symbolname+offset"):
ntkrnlpa.exe+0x6a822
ntkrnlpa.exe!ZwYieldExecution+0x1938
ntkrnlpa.exe!ZwYieldExecution+0x19a4
win32k.sys+0x2f35
win32k.sys+0x1b0d
win32k.sys!EngQueryPerformanceCounter+0x5af
ntkrnlpa.exe!KeReleaseInStackQueuedSpinLockFromDpcLevel+0xb14
ntdll.dll!KiFastSystemCallRet
notepad.exe+0x2a1b
notepad.exe+0x7511
kernel32.dll!RegisterWaitForInputIdle+0x49
... then your symbol path is set up wrong or there's something interfering with access to the symbol server. See #No symbolic names? Why?.
You might also see a backtrace like this:
00000000`0013e6b8 00000000`73d5282c wow64cpu!CpupSyscallStub+0x9
00000000`0013e6c0 00000000`73dcd07e wow64cpu!WaitForMultipleObjects32+0x32
00000000`0013e780 00000000`73dcc549 wow64!RunCpuSimulation+0xa
00000000`0013e7d0 00000000`779884c8 wow64!Wow64LdrpInitialize+0x429
00000000`0013ed20 00000000`77987623 ntdll!LdrpInitializeProcess+0x17e2
00000000`0013f220 00000000`7797308e ntdll! ?? ::FNODOBFM::`string'+0x2bea0
00000000`0013f290 00000000`00000000 ntdll!LdrInitializeThunk+0xe
with lines about wow64. This backtrace is useless for debugging. You're debugging a 32-bit binary on 64-bit windows with 64-bit debugging tools. You might be able to get a useful trace by installing and using the 32-bit debugging tools, but I haven't verified that.
Getting a stack trace using Process Explorer
Launch Process Explorer from the Start menu, or by running "procexp.exe".
You'll need to find the postgres.exe instance you're interested in. It might be one showing consistently high CPU usage, but if not, see the instructions above for finding it by process ID.
Once you know which postgres.exe backend you want to examine, double-click on it in the list in Process Explorer. In the dialog that appears open the "Thread" tab. You'll now see a list of threads. In most cases you're interested in the first thread in the list. Select it by clicking on it and click the "stack" button. After a short delay a list will appear in a new dialog, looking something like this:
ntkrnlpa.exe!KiSwapContext+0x2f
ntkrnlpa.exe!KiSwapThread+0x8a
ntkrnlpa.exe!KeWaitForSingleObject+0x1c2
ntkrnlpa.exe!KiSuspendThread+0x18
ntkrnlpa.exe!KiDeliverApc+0x124
ntkrnlpa.exe!KiSwapThread+0xa8
ntkrnlpa.exe!KeWaitForMultipleObjects+0x284
ntkrnlpa.exe!NtWaitForMultipleObjects+0x297
ntkrnlpa.exe!KiFastCallEntry+0xfc
ntdll.dll!KiFastSystemCallRet
ntdll.dll!ZwWaitForMultipleObjects+0xc
kernel32.dll!WaitForMultipleObjectsEx+0x12c
postgres.exe!pgwin32_waitforsinglesocket+0x1f0
postgres.exe!pgwin32_recv+0x90
postgres.exe!secure_read+0x17d
postgres.exe!pq_recvbuf+0x71
postgres.exe!pq_getbyte+0x15
postgres.exe!SocketBackend+0x6
postgres.exe!PostgresMain+0xbe8
postgres.exe!BackendRun+0x204
postgres.exe!SubPostmasterMain+0x224
postgres.exe!main+0x177
postgres.exe!__tmainCRTStartup+0x10f
kernel32.dll!BaseProcessStart+0x23
See how there's different text after the exclamation mark on each line? If that's not the case, your symbol path is probably set up wrong, and Process Explorer can't figure out what the program is doing. Without the text after the exclamation marks the stack trace is mostly useless, so you'll need to collect that information.
You need to copy the whole list. Click on the first entry, hold down the shift key, and press the "end" key (or scroll to the bottom and click the bottom entry), then click the "copy" button.
You can now paste the stack trace into your email program to send it to the PostgreSQL mailing list. By its self it is not useful, so you MUST provide the usual debugging information too - your OS version, PostgreSQL version, what's going wrong, what you're doing when it goes wrong, etc etc. See Guide to reporting problems.
How to make sure a stack trace is useful
A stack trace isn't always trustworthy or useful. This is particularly the case on Windows, where programs generally contain no debugging information and proper stack traces can't reliably be created without it.
If you're going to post a stack trace as part of a bug report or request for help, it's really important that it contains symbolic information about the call path, like the example posted above. If, instead, it contains just module names and numeric offsets within the modules, it doesn't tell the reader anything useful unless they know exactly what versions of the modules you have. Even then, it's difficult and cumbersome to read. So, make sure your stack trace contains lines showing modulename!SymbolicName+offset, like this:
ntkrnlpa.exe!KiSwapThread+0x8a
not just modulename+offset this:
ntkrnlpa.exe+0x8dafe
Take this trace, for example.
ntkrnlpa.exe+0x8dafe
ntkrnlpa.exe+0x29a82
ntkrnlpa.exe+0x33198
hal.dll+0x6199
hal.dll+0x63d9
hal.dll+0x6577
hal.dll+0x3902
postgres.exe!process_implied_equality+0x18d50e
The C function process_implied_equality(...) from backend/optimizer/plan/initsplan.c is deep in the query planner, and is (according to the comments) "currently used only when an EquivalenceClass is found to contain pseudoconstants". It's not going to be calling into hal.dll - not, at least, without a fairly long call chain between it and hal.dll. So we can't trust that postgres.exe was even in the process_implied_equality function when it called into hal.dll and if it was we don't have any idea how it got there. The call trace is basically useless.
Compare it to the example stack trace shown earlier in the article, where we can clearly see that PostgreSQL has called WaitForMultipleObjectsEx (to wait until data is delivered to a socket) via its win32 wrapper layer from the pg_getbyte function ... and so on.
...
kernel32.dll!WaitForMultipleObjectsEx+0x12c
postgres.exe!pgwin32_waitforsinglesocket+0x1f0
postgres.exe!pgwin32_recv+0x90
postgres.exe!secure_read+0x17d
postgres.exe!pq_recvbuf+0x71
postgres.exe!pq_getbyte+0x15
postgres.exe!SocketBackend+0x6
postgres.exe!PostgresMain+0xbe8
...
No symbolic names? Why?
Your stack traces aren't showing !SymbolicNames, and you don't know why. Here are a few possibilities.
No symbols for the module
You might simply not have any way to get symbols for the module you're debugging. If you're finding that most of the stack trace (at least the parts in the system DLLs and NT kernel) have symbolic names shown, but other parts don't, it's quite likely you just have no debugging information (pdb files) for those parts.
This shouldn't be the case for PostgreSQL if you've set up the symbol path to point to the symbols for your version of PostgreSQL as well as the Microsoft Symbol Server, though.
_NT_SYMBOL_PATH not set
Are you sure you set the _NT_SYMBOL_PATH environment variable?
In the Start menu choose Run, then enter "cmd" and press enter.
In the resulting window, type in exactly:
set | findstr symbol
You should get the following result, allowing for differences in PostgreSQL versions, drive letters, etc:
_NT_SYMBOL_PATH=c:\program files\postgresql\8.4\symbols;SRV*c:\localsymbols*http://msdl.microsoft.com/download/symbols;
Note that _NT_SYMBOL_PATH is in capitals, with underscores between words and a leading underscore.
The same string should show up in Process Explorer, in Configure Symbols under the Options menu.
Add-in software firewall
Do you have an add-in software firewall installed? The firewall built in to Windows will not cause problems as it only affects listening sockets and incoming connections, but 3rd party firewalls often block outbound connections too. This may prevent access to the symbol server from working.
Make sure your software firewall allows access to msdl.microsoft.com on port 80 (http), and/or add exemptions for procexp.exe and windbg.exe.
Initially written by Craig Ringer --Ringerc 10:06, 29 July 2009 (UTC)

Sections on remote debugging, software firewall, troubleshooting bad stack traces, identifying a useful stack trace, and debugging with Visual Studio added --Ringerc 06:25, 22 August 2009 (UTC)

